Tableau Tutorial for Beginners
Introduction
Tableau is a data analytics and visualization tool used widely in the industry today. Many businesses even consider it indispensable for data-science-related work. Tableau’s ease of use comes from the fact that it has a drag and drop interface. This feature helps to perform tasks like sorting, comparing and analyzing, very easily and fast. Tableau is also compatible with multiple sources, including Excel, SQL Server, and cloud-based data repositories which makes it an excellent choice for Data Scientists.
In this Tableau Tutorial, you will be learning the following topics
- What Is Tableau?
- Importance Of Data Visualization
- Why Tableau?
What is Tableau?
Tableau is one of the most fast-growing data visualization tools which is currently being used in the BI industry. It is the best way to change or transform the raw set of data into an easily understandable format with zero technical skills and coding knowledge.
Importance of Data Visualization
Data Visualization is one of the most important part of data analysis. It has always been important to present the data in an understandable and visually appealing format. Data visualization is one of the skills that Data Scientists have to master in order to communicate better with the end users
Data is the word here -
Let me first give you an idea of the kind and amount of data that we are dealing with. According to SiliconAngle, there was 2.5 zetabytes of stored data world over in the year 2012 and it is set to hit more than 50 zetabytes mark by the end of 2017. To put things in perspective, this data has largely been produced by websites and cross platform transactions. Add to it the fact that there would be a total of 20 billion “smart” devices connected to the internet by the end of 2020 and the numbers can be baffling!
Data visualization allows data scientists to converse with their end users. The outcome of data analysis is not immediately comprehensible to the people who do not directly deal with data. Data visualization bridges that gap and makes people appreciate the possibility of data analysis.
Let us consider the following example to understand this:
The following image shows the x and y co-ordinates of different points to be plotted on a graph. The numbers look almost the same, don’t they? Maybe the lines will look similar after we plot each set on the graph
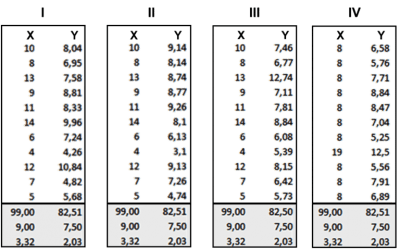
So, now take a look at the image below when we plot these points in our graph:
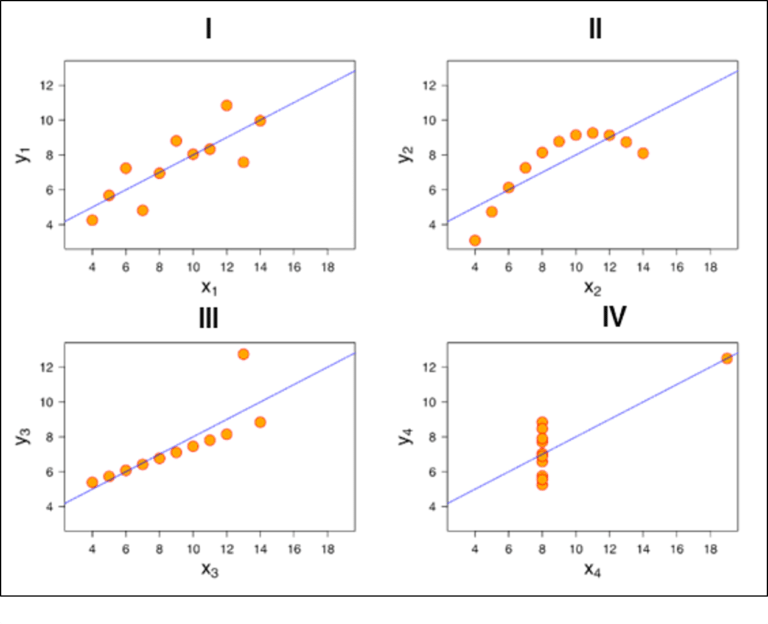
You see how different they look like when you actually visualize it. It wasn’t possible for us to figure out the nature of each line until we visualized it
Why Tableau?
Below are some of the pros or features of Tableau which will spellbind you to start using it right away!
Tableau Features:
1. Apt visualizations: Tableau connects to many different data sources and can visualize larger data sets than Power BI can. Once in Tableau, a dashboard shows the basics of the users’ data. The user can then drill down into data sets by downloading a worksheet. From there, they can apply various visualizations to the data.
In Tableau, you select the data and switch between visualizations on the fly. It’s easier to jump between visualizations in Tableau.
Tableau visualizes data from the start, allowing you to see the significance right away. Tableau differentiates correlations using color, size, labels and shapes, giving you context as you drill down and explore on a granular level
2. Depth of discovery:
The features of Tableau gives users ways to answer questions as they investigate data visualizations. The solution can show basic trends as predictions, use “what if” queries to adjust data hypothetically, and visualize components of data dynamically for comparisons
3. Implementation:
Tableau provides a variety of implementation and consulting services. For enterprise-level deployment, there’s a four-step process spanning weeks, and for smaller-scale deployments, there are quick-start options that can complete setup in a matter of hours.
Tableau provides a variety of implementation and consulting services. For enterprise-level deployment, there’s a four-step process:
- Phase 1 – This phase involves IT planning, architecture consulting, pre-install checkup, server installation and verification, and validation of security configuration
- Phase 2 – Phase 2 involves working with data and data migration, including data modeling, data mining, data extraction, data sources and business workflow
- Phase 3 – In Phase 3, there’s a two-day classroom training covering Tableau Fundamentals, hands-on advanced coaching, and building and formatting visualizations
- Phase 4 – This final phase helps companies expand Tableau usage across their business. It includes implementation workshops where topics such as evaluating action plans and defining measurable outcomes are discussed
4. Automation functionality:
Tableau is a little more intuitive with creating processes and calculations. For example, when creating calculations in a tabular format, the formula can be typed once, stored as a field and applied to all rows referencing that source. This makes it easier to create and apply recurring processes.Tableau flexibility also allows users to create custom formulas that aren’t available in most of the tools
5. Data source connectors
Tableau offers hundreds of native connectors to easily pull, cleanse and correlate data from practically any source without having to create custom code. Tableau extracts large data sets from sources for quick, ad-hoc analysis using two different methods: Live Connection and In-memory. Both adapt to your local database and, based on the size and capacity, sync data quickly by extracting the relevant data to a query. It also has a general Open Database Connectivity (ODBC) connection for any connections that don’t have a native connector provided. This is the reason, you can see an increasing demand graph for Tableau certification training.